- Normal/gaussian distributions
- The mean is the peak of curve – it is symmetrical around its mean
- The standard deviation determines width of curve (the larger the SD, the wider the curve)
- Normal distribution tends towards infinity (i.e. the line never reaches the axis)
- Reference range for a sample = mean +/- 2 standard deviation

Non-normal distribution/skewness:

| NEGATIVE SKEW or LEFT SKEW Long tail on left (cluster of lower values) Mean < median Normalise with square or exponential transformation (square or ex) | POSITIVE SKEW OR RIGHT SKEW Long tail on right (cluster of higher values) Mean > median Normalise with log or square root transformation |
- Measures of central tendency (a measure of central tendency is a single value that attempts to describe a set of data by identifying the central position within that set of data):
- Normal distribution
- Mean & SD
- Non-normal distribution
- Median & interquartile range
- Normal distribution
To summarise non-normal distributions – use the median and IQ range OR transform data to achieve normal distribution to then perform statistical analysis (many tests have an underlying assumption of normally distributed data to be valid)
- Sampling
- In medical statistics, the population is the entire group of individuals of interest
- However, it may be expensive or not possible to collect data on the whole population
- Therefore, data is collected on a sample of the population, who are believed to be representative of the population
- Conclusions can then be made along with inferences about the population
- Source population – the real population you would like to infer about and from which your study participants are taken from
- Sampling frame – list of all individuals in source population
- Study population – population from which you sample from
- Sampling methods – how you choose sample from study population
Sampling methods
- Sampling methods refer to how members of the population are selected to be in the study
- Sampling methods can include:
- Population
- Data is collected on every individual in the source population
- Random
- Each individual is chosen by chance
- Each member of the source population has an equal chance/probability of being chosen
- Example – If you have a sample frame of 1000, each individual is labelled 1-1000, and a random number generator is used to select the sample
- Systematic
- Individuals are selected at regular intervals from the sampling frame
- Example – If you have a sample frame of 1000, labelled 1-1000, instead of using a random number generator, individuals are chosen are regular intervals
- Stratified
- The source population is divided into subgroups/strata who share similar characteristics, then equal sized samples are taken from each stratum
- It might be used when the population has mixed characteristics and each characteristic needs to be proportionally represented in the sample
- Cluster
- This also involves dividing the population into subgroups/clusters, but each subgroup has similar characteristics to the whole population… Then instead of sampling individuals from each subgroup, entire subgoups are selected
- Population
( These are examples of Probability sampling – each member in the source population has a known chance of being included)
- Consecutive/Convenience
- Individuals are chosen based on availability/willingness to take part
- Voluntary response sampling
- Participants are selected based on their availability/willingness to take part but instead of the research team identifying the individuals, people volunteer themselves (e.g. by responding to a public online survey)
( These are examples of Non-probability sampling )
Sampling distribution of the mean and standard error of the mean
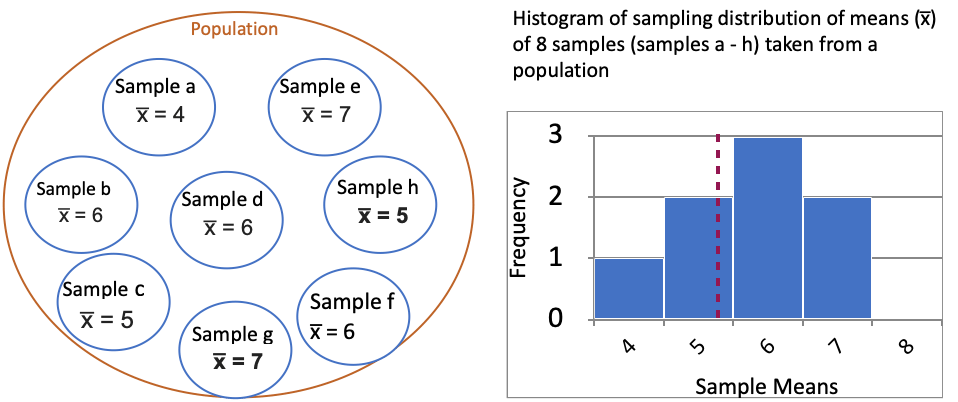
Standard deviation of this sampling distribution is = 1.035
Standard error of this sampling distribution is SD / √n = 1.035 / √8 = 0.366 Thus SEM (Standard error of the mean) = 0.366
- Sampling distribution of the mean
- This is the distribution of sample means from multiple samples of a fixed size from the population
- To estimate the population mean… Take multiple samples of size n from the population… Then estimate the mean in each sample… A histogram of these means shows their distribution which is the sampling distribution of the mean
- It follows the central limit theorem
- Standard deviation of the means of multiple samples will get smaller as size of samples increase – i.e. the curve will get narrower as the sample size gets larger

- Standard error of the mean
- This is the standard deviation of the distribution of sample means (from many samples)

Where SD is the standard deviation & n is the size of the sample
- Standard deviation vs standard error of the mean
- Standard deviation
- Descriptive (about sample)
- It is used to describe variation/spread in the sample/data values
- Standard error of the mean
- Inferential (about population)
- It is used to describe variation in mean of many samples/sets of data values
- It gives a measure of precision of the estimate of the mean
- It is always smaller than the sample standard deviation
- Smaller SE indicates more precision than larger SE
- Standard error/precision is determined by sample size & variance
- Standard deviation
- Central limit theorem (CLT)
- The CLT is that the sampling distribution of the mean will always be approximately normally distributed even if the underlying population distribution is not
- Predicts the mean of the sampling distribution will be the population mean
- As long as:
- Sample size is large enough
- Samples are randomly drawn
- Standard error of the mean vs sample error of a proportion
- Standard error of the mean
- Remember, this is the standard deviation of the distribution of sample means (from many samples)
- This follows CLT
- Standard error of a proportion
- Used to obtain proportion of individuals who may possess a particular factor of interest
- Standard error of a proportion is the distribution of sample proportion obtained, after taking repeated samples of a fixed size
- This also follows CLT
- Standard error of the mean

- Where p is the sample proportion & n is the size of the sample
Confidence Intervals
- Confidence intervals
- Inferentialstatistic (about the population mean)
- 95% Confidence Interval = mean +/- 1.96 x Standard Error
- It is a range of values, within which, you can be 95% sure that the true population parameter lies
- Reference range vs confidence interval
- Reference range
- Descriptive (about sample)
- Sample mean +/- 1.96 SD
- Reports where 95% of the sample lies
- Confidence interval
- Inferential (about population)
- Sample mean +/- 1.96 SEM (standard error of the mean)
- Because this equation uses SEM and not SD – it is will be a narrower interval
- Reports where the population mean lies 95% of the time
- Reference range
