- Time to event (TTE) data
- Analysis of data from a point in time until a particular event. In many oncological studies event is death or event is disease progression.
- It is not normally distributed
- It is continuous data
- Survival data/analysis is a type of TTE data/analysis
- Data may often be censored
- Right censored – patients who have not reached end point of interest when they were last under follow up e.g. lost to follow up, still alive at end of mortality study.
- Left censored – patients whose end point of interest occurred before the baseline/initial date of study. (for obvious reasons – survival data with event as death cannot be left censored)
e.g. If Event is “To Learn how to operate new chemo e-prescription system.” And time to event is time to first successful independent prescription of first chemotherapy regimen. Some registrars might already be competent and have completed a prescription (left censored), some might learn and complete and task during the study period (exact event time) and some might not learn / successfully complete task until the end of the study period (right censored).
Summarising survival data
- Summarising survival data:
- Actuarial life table
- Kaplan meier curve
- Actuarial life table
- Tabulate total number of patients, number of events & number who are censored, to calculate:
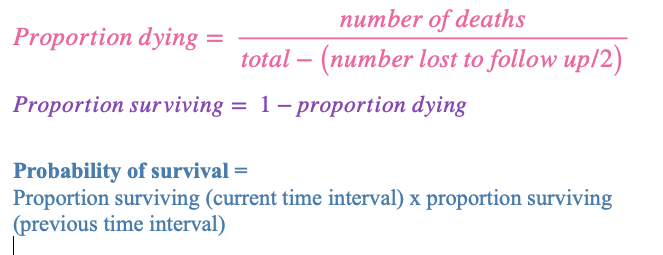
- Proportion dying
- Proportion surviving
- Probability of survival
- Tabulate total number of patients, number of events & number who are censored, to calculate:
| Age | Number | Deaths | Lost to FU | Proportion dying | Proportion surviving | Probability of survival |
| 1-10 | 10 | 2 | 0 | 2/10 = 0.2 | 0.8 | 0.8 |
| 11-20 | 8 | 1 | 1 | 1 / (8 – 0.5) = 0.13 | 0.87 | 0.8 x 0.87= 0.69 |
| 21-30 | 6 | 2 | 2 | 2 / (6-1) = 0.4 | 0.6 | 0.87 x 0.6= 0.41 |
- Kaplan Meier curve
- Summarises survival data graphically
- Probability of survival is plotted on Kaplan Meier curve (survival will only change when an endpoint occurs)
- The bottom of the survival curve often has number at risk
- The drops in a KM curve are events.
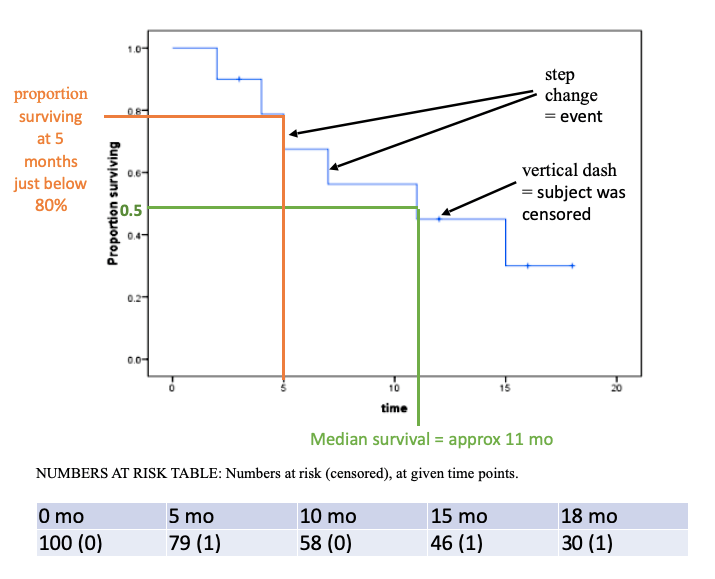
- Data which can be summarised from kaplan meier curves includes:
- Median survival (as long as >50% have had event – if not then ‘median survival not reached’)
- Estimated % surviving at fixed time points
- If KP curve shows number at risk – how many have had event/been censored
- Kaplan meier (KM) curves assume several things:
- Survival probability is the same in those who are censored vs remain
- Survival probability is the same no matter where they are in the study timeline
- Surviving proportion remains static between events
Comparing survival
- Tests used to compare survival data/TTE data:
- Log rank test
- Hazard ratio
- Cox proportional hazard regression
- Log-rank test
- Use to compare ≥2 survival curves
- Non-parametric method – tests null hypothesis
- This calculates the log rank statistic, you then compare this with the Chi2 (X2) distribution, this gives p value
- Hazard ratio
- Used to compare 2 hazard rates – each group has a hazard rate which relates to KM curve
- Hazard rate = probability of event per unit time

- Results:
- Hazard ratio (HR) <1 – less chance of dying in treatment group
- HR >1 – more chance of dying in treatment group
- Can also calculate CI – if crosses 1 –> not significant
- Cox proportional hazard regression
- Used to compare effect of multiple variables on outcome
- Cox regression – regression analysis where the outcome is a survival curve
- Assumes hazard ratio remains constant over time
- If curves crossover on kaplan meier curve, this means that the HR is non constant. You would therefore use cox non-proportional hazard regression instead
- Results:
- HR <1 – decreasing chance of TTE with increasing X
- HR >1 – increasing risk of TTE with increasing X
