Sample size calculations
- Sample size calculations need to be done before data collection
- Sample size calculations are done in a statistics package
- Factors that influence sample size calculation:
- Expected effect size – if expected effect size is ↑, can have ↓ sample size to detect difference
- Expected variability (SD) of data – look at previous trials for approximation
- Significance level (α) – threshold to reject null hypothesis
- Power (1 – β) – ability to detect a difference if there is one
Interim analysis
- Interim analysis (analysis before trial has completed) to decide whether study should be stopped early
- Decide on stopping rules (boundaries to stop trial once crossed) dependant on:
- Efficacy – works better than expected
- Safety – more adverse events than expected
- Futility – works worse than expected
- Performing interim analysis will increase type 1 error rate and increase the chances of falsely rejecting the null hypothesis… therefore, the final analysis has a lowered α to control & account for this, and the sample size will likely need to be increased accordingly
Intention to treat analysis
- Intention to treat is when data is analysed as randomised
- It includes all randomised patients in the groups to which they were randomly assigned regardless of the treatment they actually received/compliance with entry criteria/subsequent withdrawal from trial
- ITT allows for non-compliance and deviation from policy by clinicians… so gives a pragmatic estimate of the benefit of a change in treatment policy rather than potential benefit in patients who received treatment as planned
- Limits bias but leads to missing outcome data
- In event of missing outcome data, perform sensitivity analysis…
- Use different scenarios/assumptions regarding the missing data (explicit or implicit) to find out how significantly the missing data might alter the results – this limits bias
- ITT is the opposite to ‘per protocol’ analysis – what they actually did/what treatments participants actually received
Levels of evidence
| 1a | Systematic review of RCTs |
| 1b | Individual RCT (with narrow confidence interval) |
| 2a | Systematic review of cohort studies |
| 2b | Individual cohort study & low quality RCT |
| 3a | Systematic review of case-control studies |
| 3b | Individual case-control study |
| 4 | Case series |
Meta-analysis & systematic reviews
- To perform a systematic review of clinical trials:
- Identify a question & define objectives for review
- Set inclusion & exclusion criteria & search for trials
- Evaluate study quality (methodology, risk of bias) of studies identified
- Extract statistical summary data or obtain raw data
- Estimate overall treatment effect by a meta-analysis
- Analyse data = perform a meta-analysis to estimate overall effect
- Meta-analysis will address:
- Homogeneity of studies
- Homogeneity of studies is needed to justify overall treatment effect
- If all studies in a meta analysis are studying the same thing you would expect the effects to be consistent and any heterogeneity to ideally be due to chance.
- If not, the effect could be due to one study/intervention or characteristic/subgroup analysis.
- Index I2 (the outcome of which is 0-100%) can be used to assess impact of heterogeneity – 0% indicates no heterogeneity
- As a rule of thumb you want the I2 to be less than 50.
- Overall treatment effect (overall & subgroups of trials)
- Meta-regression
- Aims to estimate effect of interest after adjusting for differences between studies
- Forest plot
- Used to display results of meta-analysis
- a vertical line is typically plotted at the null hypothesis – if any studies have their CI crossing the midline, usually that indicates lack of statistical significance as the CI includes the ‘null hypothesis’. It is also called the “line of no effect”
- Each study included in the meta-analysis is represented
- Display shows mean & CI (represented by box & whisker plot) of each study then and total mean & CI (usually a diamond at the bottom)
The below graphic represents a meta-analysis forest plot of cohort studies reporting the risk ratio of gastric cancer following eradication of H. pylori (experimental group) vs no eradication (control group). 6 independent studies are all statistically insignificant as the 95% CI crosses 1 for all the independent risk ratios. However, the summative overall effect is statistically significant – 0.66 (0.46 to 0.95), favouring a 34% reduction in risk of developing gastric cancer with H. pylori eradication compared to controls. The I2 statistic is 0%.

- Whether study size is related to the magnitude of treatment effect: Examining bias.
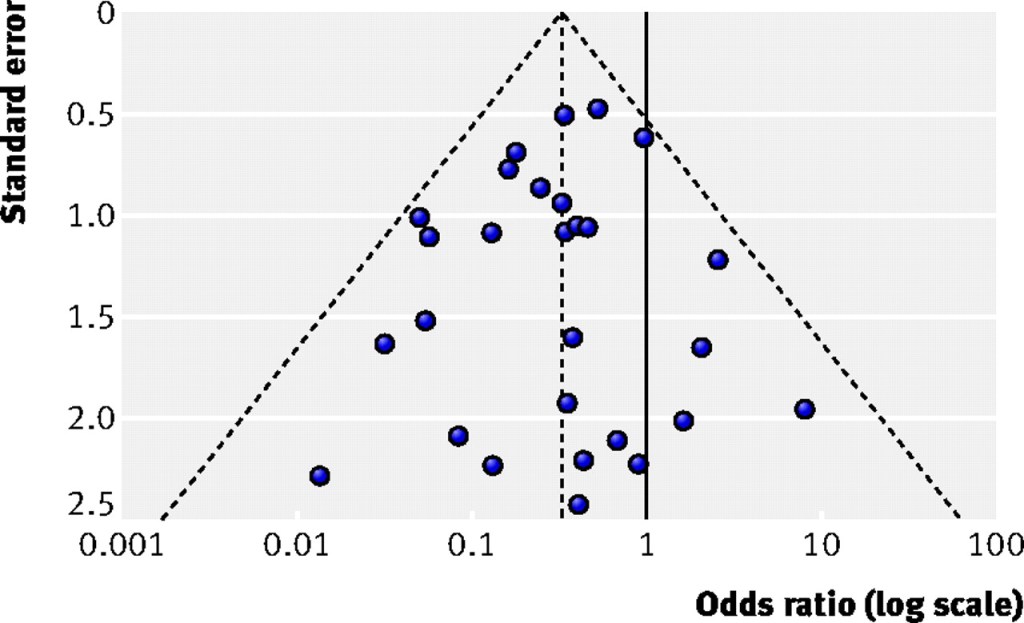
- Funnel plot
- Used to detect publication bias & small study problem.
- Scatter diagram with a measure of study precision on y-axis & treatment effect on x-axis
- Measures of precision on y axis can include study size or standard error (SE is preferred)
- It depends on a fixed effect assumption – that the true treatment effect in all studies studying the same thing is the same, i.e., ideally there would be 0% heterogeneity between studies and they will all report the same treatment effect.
- The central vertical dashed line represents the estimated fixed summary effect and the dashed edges of the triangle are the 95% CI (+/-1.96 x SE) within which you would expect 95% of the studies to lie if there was no bias or study heterogeneity.
- If there is no asymmetry – plot will be larger at the bottom & smaller at the bottom. As the study precision increases, the variability in effect should decrease.
- If publication bias (or other factors influencing asymmetry) are present – plot will be skewed/asymmetrical +/- gap bottom left where study size & treatment effect is small (small study problem – small studies have low power to detect small effect)
Relative Risk and Absolute Risk
Rate is the number of events/ group total
The number of events/group total in the treatment group/experimental group is called experimental event rate (EER)
The number of events/group total in a control group is called control event rate (CER)
Relative risk = EER / CER
A. For example, if 10/100 patients on aspirin had a heart attack, EER = 0.1. And if 15/100 patients as controls had a heart attack, CER is 0.15. Relative risk is 0.66 for patients on aspirin relative to controls.
B. Similarly if 10/100,000 patients on aspirin had a heart attack and 15/100,000 controls had a heart attack, EER = 0.0001 and CER is 0.00015 and RR = 0.66!
Relative risk reduction is 1- RR, in the above example, RRR = 0.34 or 34%. Hence patients on aspirin are 34% less likely to get heart attacks relative to controls.
Notice how the relative risk gives you a comparative risk between groups but doesn’t give you a clear idea of magnitude of difference between the two groups. RRR tries to define this difference but is directly dependent on RR. Without the context of baseline absolute risk – these can be meaningless.
Absolute Risk Reduction (ARR) or Absolute Risk Increase (ARI) gives you an idea of magnitude of difference in risk between two groups.
ARR = CER – EER ( if the outcome or event is decreased by exposure, e.g., fewer heart attacks in the aspirin groups compared to controls.)
In these examples:
Example A: ARR = 0.15 – 0.10 = 0.05 or 5%)
Example B : ARR = 0.00015 – 0.0001 = 0.00005 or 0.005%
ARI = EER – CER (if the outcome of event is increased by exposure, e.g. more cancers in the smoking group compared to controls)
Number needed to treat or Numbers needed to harm
- NNT: Number of patient who would need to be exposed or receive a treatment for one of them to receive benefit or to prevent one bad event. NNT = 1/ARR
- NNT = 1/0.05 = 20 patients.
- 20 patients need to be treated with aspirin to prevent one heart attack.
- NNH: Number of patients who need to be exposed or receive a treatment to harm one patient or cause one bad event. 1
- NNH = 1/ARI
